Donchian Channel Strategy for Crypto: Why Standard Settings Fail (and How Quants Fix It)
Donchian Channel Strategy for Crypto: Why Standard Settings Fail (and How Quants Fix It)
Trend following is one of the most robust styles of trading across financial history. But apply traditional trend-following indicators to cryptocurrency markets without modification, and the results are often brutal.
Many traders turn to the Donchian Channel — a classic, time-tested indicator — hoping to catch the next Bitcoin super-cycle. The problem is not the indicator itself. The problem is using standard, single-timeframe settings in a market built to punish that exact approach.
This article covers what the Donchian Channel is, why its basic application consistently fails in high-volatility environments, and how systematic quant funds use a 9-Timeframe Ensemble to filter noise and capture genuine alpha.
What Is the Donchian Channel?
The Donchian Channel was developed by Richard Donchian, widely regarded as the father of systematic trend following. It is a price-action indicator that maps the extremes of an asset's price over a defined lookback period. Unlike Moving Averages, which react to every price change and lag heavily, or Bollinger Bands, which incorporate statistical standard deviations, Donchian Channels are purely structural. The indicator consists of three lines:
- Upper Band: In this implementation, the highest completed close over the last N periods.
- Lower Band: In this implementation, the lowest completed close over the last N periods.
- Middle Band: The midpoint between the two.
The core long-only logic is simple: enter long when the completed daily close reaches the Upper Band and move back to flat when the completed close hits the active trailing stop. Short logic belongs to a separate appendix-style extension, not the core model described here. In traditional equities and commodities, a 20-day setting (N=20) has historically been the most common starting point.
The Fatal Flaw of Single-Timeframe Donchian in Crypto
If the Donchian Channel has such a strong historical track record, why do crypto traders consistently lose money applying it?
The answer is volatility and liquidity grabs. Crypto markets do not trend in clean, orderly lines. They are engineered for "whipsaws" — sudden, violent price spikes that trigger breakout signals on a single timeframe, only to reverse immediately and liquidate late entrants.
Consider a concrete scenario. A single whale sells aggressively into a resistance zone. This creates a false breakout above your 20-day Donchian upper band. You enter a long. The apparent trend collapses within hours. You are now holding through what becomes an 80% bear market drawdown.
This is not bad luck. It is a structural consequence of relying on a single lookback period in a market with extreme volatility and thin liquidity. A single timeframe is simply too noisy.
The Institutional Solution: The 9-Timeframe Ensemble
Systematic quantitative funds do not rely on a single indicator setting. Instead of asking "Is the 20-day trend bullish?", they ask a better question: "Is there consensus across all micro and macro timeframes?"
Research on ensemble approaches to trend following — including the 2025 SSRN paper "Catching Crypto Trends" — demonstrates that cross-sectional multi-model methods are significantly more robust than any single-parameter strategy. Rather than one Donchian Channel, a professional quant model tracks multiple lookback periods simultaneously.
A robust implementation tracks 9 separate Donchian timeframes: 5, 10, 20, 30, 60, 90, 150, 250, and 360 days.
How the voting mechanism works:
Each of the 9 channels independently assesses whether the completed close is in an active long state: 1 for active long and 0 for flat.
These votes are aggregated into a single Bias Index — a consensus score representing what percentage of all 9 timeframes are currently in an uptrend structure.
The key insight: if the 5-day channel fires a bullish breakout, but the 150-day and 360-day channels remain flat, the aggregate Bias Index remains low. The system does not take the bait on a short-term pump. It waits for genuine, cross-timeframe confirmation before treating a signal as actionable.
Reading the Bias Index: From Noise to Signal
The Bias Index compresses 9 independent trend readings into a single number between 0% and 100%.
| Bias Index | Status | Interpretation |
|---|---|---|
| 0 – 22% | NEGATIVE (Strong) | Near-universal flat consensus. New longs carry extreme risk. |
| 22 – 40% | NEGATIVE | Few active long windows. Uptrend confirmation is weak. |
| 41 – 59% | NEUTRAL | Mixed signals. No clear directional edge — stay sidelined. |
| 60 – 78% | POSITIVE | Majority bullish. Trend-following entries are worth considering. |
| 78 – 100% | POSITIVE (Strong) | Near-total consensus. Strong uptrend — also assess for overextension. |
A genuine trend reversal does not flip the Bias Index overnight. It typically moves gradually — from 22% to 44% to 67% to 89% — as shorter-term channels confirm first, followed progressively by the longer-term frames. That gradual accumulation of agreement is the signature of a real trend change, not a short-term bounce.
Defense First: Volatility Targeting
Knowing the trend direction is only half of the problem. The other half is position sizing under uncertainty.
When Bitcoin drops 15% in a single day, maintaining a standard fixed position size is an asymmetric bet against the house. Professional quant funds address this with Volatility Targeting: position sizes are inversely scaled to the asset's trailing annualized volatility (typically measured over 90 days).
During high-volatility regimes, exposure is reduced automatically. During calm, low-volatility trending environments, exposure is allowed to scale up. The result is a portfolio that breathes with market conditions rather than fighting them.
The historical impact of combining a multi-timeframe Donchian ensemble with strict volatility targeting is significant. In backtests on crypto assets, this combination has reduced maximum drawdowns from the 80%+ range down to approximately 10–15%, while preserving participation in major uptrends. No strategy eliminates risk, but this framework meaningfully changes the distribution of outcomes.
Measuring vs. Predicting: A Critical Distinction
A common misconception is that a tool like this is trying to predict whether crypto will go up or down. It is not.
"We do not predict. We only measure the market's consensus."
This distinction matters. A prediction is a claim about an uncertain future — it can be wrong in ways that are difficult to anticipate. A measurement is an objective description of the present market structure: how many of the 9 monitored timeframes currently exhibit an upward-trending formation. Whether that structure persists is always the investor's judgment call.
The 9-channel ensemble does not claim "Bitcoin will rise next week." It states: "Currently, X of the 9 timeframes we monitor show an upward structure." That is a measurement of observable fact, not a forecast. The algorithm is a co-pilot — it informs the decision, it does not make it.
The Limits of This Approach
Honest acknowledgment of limitations is a prerequisite for responsible use of any technical tool.
Black swan events bypass all technical analysis. The March 2020 COVID crash and the November 2022 FTX collapse are textbook examples. External shocks of sufficient magnitude override market structure, and no ensemble of trend indicators will provide advance warning.
Ranging, low-volatility markets are another challenge. When price oscillates within a tight range without establishing a trend, individual channel signals flip frequently and the Bias Index becomes unstable. As a trend-following tool, Donchian Channels are least effective precisely when there is no trend.
All technical analysis is backward-looking. It is based on the assumption that past structural patterns carry forward predictive relevance. If the market's fundamental behavior changes, historical reliability may not hold.
These limitations are why the Bias Index should be used as one input in a broader decision process — not as a standalone oracle.
From Manual Calculation to a Live Dashboard
The math behind a 9-timeframe Donchian ensemble and daily volatility targeting is well-defined, but calculating it manually across multiple assets every day is not practical for most traders.
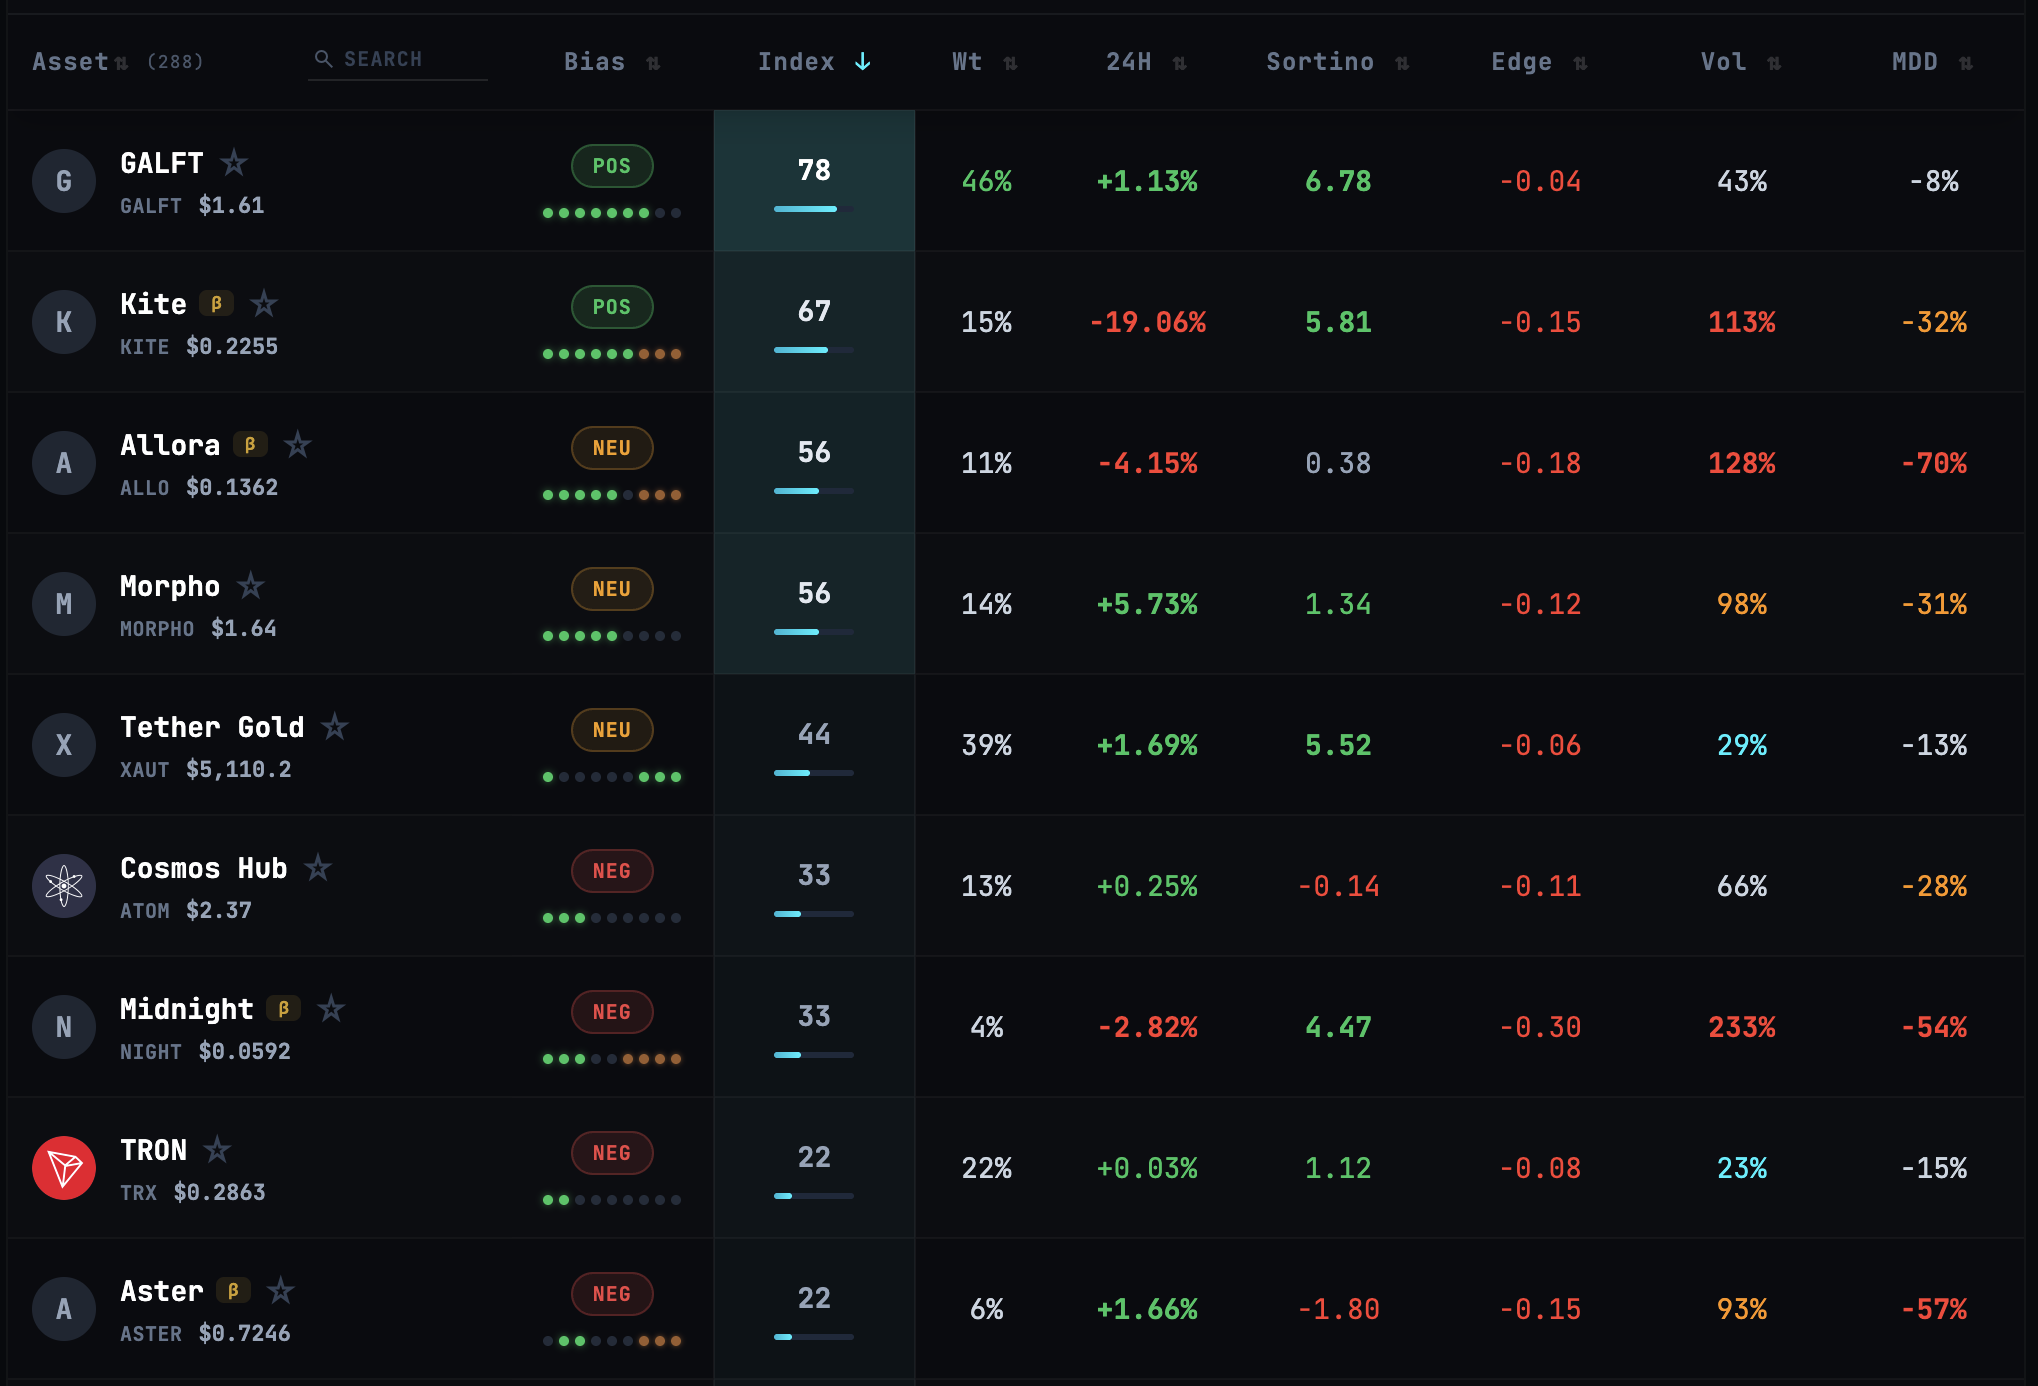
TrendShield automates exactly this. The platform tracks the 9-model Donchian Bias Index and Volatility-Adjusted Position Weights (Wt) for the top crypto assets in real-time, surfacing the same systematic framework that institutional funds use — without requiring you to build it from scratch.
Check the live signals at trendshield.pro.
⚠️ Important Disclaimer
- All figures and signals provided by this service are the result of statistical analysis based on historical data and do not guarantee future returns.
- This content is intended solely for educational and informational purposes and does not constitute financial advice.
- Cryptocurrency markets carry substantial risk of loss. Past performance of any strategy or indicator is not indicative of future results.
- Always conduct your own research and consult a qualified financial advisor before making any investment decisions.